Weather Station
Background
Recently I bought a new house and decided I was finally going to make building a weather station a priority. Hopeful that this would be a forever home, I wanted to have environment data stored from the beginning (or as close as possible).
Fast forward about six months, $1000 and 200 hours of work later:
Design
Sensors
A few years ago I picked up a Rainwise rain gauge and a Peet Bros anemometer. The rain gauge managed to get installed at my last house but I never connected it to any form of actual data logger, just the little LCD display it came with. The anemometer never left the box it came in… It turns out I love ordering parts with great intentions but don’t always get around to using them too quickly.
So given that I already had these parts, I decided to make good use of them. Additionally I looked to see what other sensors I could add, the obvious ones being temperature and humidity, and barometric pressure. I also decided it might be interesting to measure light intensity and UV intensity.
Wireless
I wanted to install the anemometer in a location that would get the best wind, and what I call the “base” weather station in an area that got the most sunlight and was also slightly shielded from the wind to help with rain collection. This meant I needed to install them a few hundred yards from my house and in separate locations. This distance and low power requirement ruled out Wifi, Bluetooth, and Xbee type radios. Ultimately I decided on a 900MHz packet radio setup which would cover the range required while still meeting the power requirements to run off a battery and solar cell.
The Adafruit Feather 32u4 RFM69HCW would be the core of the remote stations and corresponding standalone radio which would be wired to a Raspberry Pi inside the house.
Data Storage
Over the years I’ve had a lot of time to think about storing time series data, and I’ve had the experience of using several different solutions for doing so.
Ultimately I decided on Timescale, there were several reasons for this, most of which you would read on their website. After having used both traditional relational databases and NOSQL type databases for time series data I have always preferred relational databases in every way EXCEPT the part where they really struggle when you start getting billions of rows in a table. This is the problem that Timescale solves by auto partitioning your table for you behind the scenes.
I’m not saying another solution isn’t better for you or your situation, but for me Timescale is fantastic.
As far as structure goes, I waffled a long time about storing data in a narrow table vs a wide table.
A narrow table model being something like:
|
|
In this model, every sensor reading gets a unique row. The advantage is it’s ultra flexible and simple, you can put as many types of sensors in here as you want and you never need to change the schema of the table.
The disadvantage is this table will grow in row count very very quickly, and maybe a bigger disadvantage, correlating data is a huge pain in the ass. If you take my base station which is sending in almost 10 different readings from the light sensors, and you wanted to know what the IR light reading was and the UV light reading, you have to correlate those through a sub-select and it’s painful.
So what about a wide table?
|
|
In this model, we would insert all the values we read into one row with the same timestamp, this makes correlation trivial, and it reduces our row count drastically. However, it’s not as flexible, requiring an alter statement if we want to add a new measurement type to the table.
In the end I actually decided to use both models, data which is highly correlated gets it’s own wide table as you can see above with the outside_light table.
Data that is not very correlated, goes into the narrow table. This includes things like rain bucket tips, and battery voltage readings from the remote stations.
Visualization
Another really big win for me is that Grafana just recently added support for PostgreSQL and Timescale, allowing me to use my favorite visualization tool. Honestly had support for Timescale not been there, I probably would have used InfluxDB because I really don’t know of anything that visualizes time series data as well as Grafana.
Hardware Setup
I didn’t create any schematics for this… sorry… It’s been so long since I’ve done any schematic design/hardware work that I don’t even know what tool I would use to capture the schematic. Also the wiring for this project in most cases is incredibly simple, just connecting several different data buses (I2C, SPI, and Serial), with a few interrupts used for the rain bucket and anemometer.
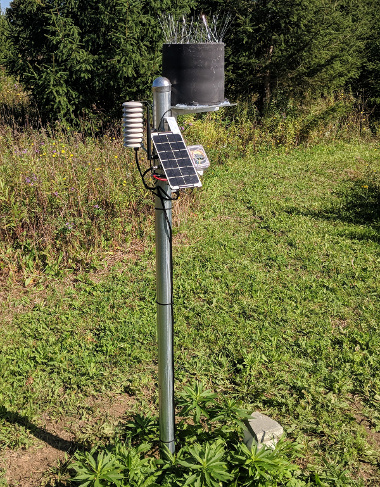
Base Internals
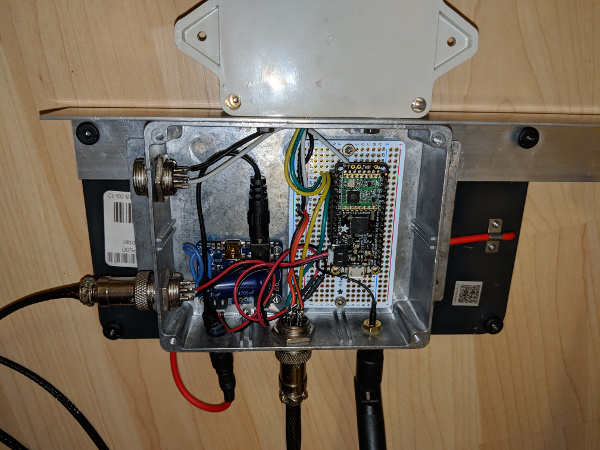
In the bottom left is the solar charge circuit which receives power via that red cable from the solar panel, the connector to the left of it sends power to the battery which is buried in a PVC pipe about 4’ into the ground to try and keep it below the frost line, as you are not supposed to charge lithium ion batteries below freezing temps.
The connector to the right of the red cable is I2C and power to the temp/humidity sensor which is inside a solar radiation shield.
On the top side of the box are I2C and power that go to the two light sensors:
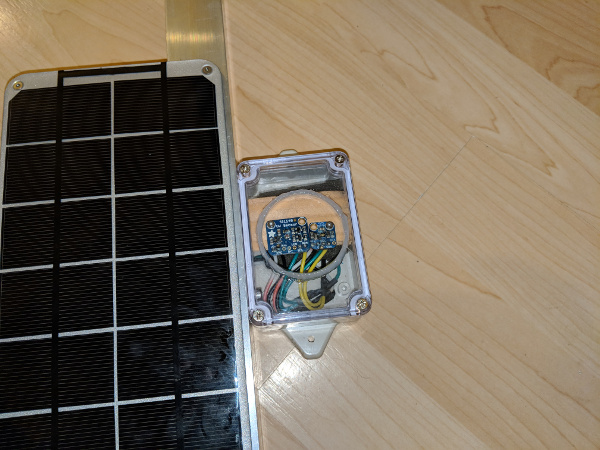
In front of the sensors is a $100 piece of UV transparent glass which I bought after hours of searching the internet for UV transparent glass/plastics…. Normal glass/acrylic blocks a large amount of UV which would really screw up my UV measurements. The datasheets for the parts recommend a material that nobody makes anymore. The most common material you can find which is UV transparent is tanning bed glass (which is usually acrylic) but good luck finding anything larger than a 4’x8’ piece. Finally I said fuck it and ordered this window from Edmond… Also searching for UV transparent glass is extremely difficult with nearly every result talking about UV filtering glass….
At any rate, I cut out the plastic and siliconed in my expensive window in front of the sensors so they could have the best reading possible while still protecting them from the elements.
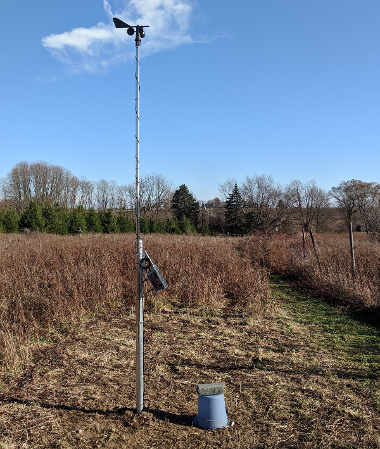
Anemometer Internals
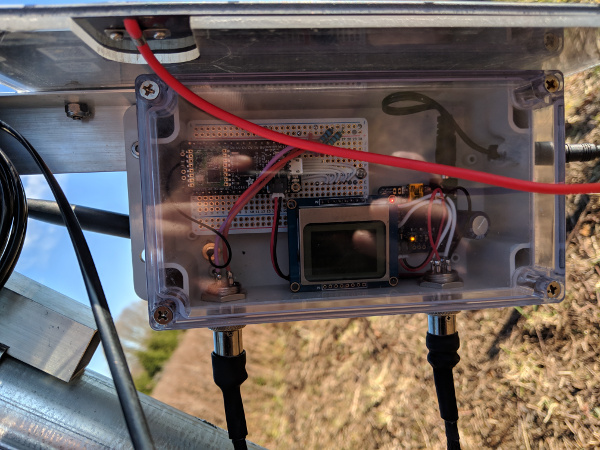
The setup for the anemometer was similar and a little simpler than the base station, it has the same solar charge controller in the bottom right, and the left most connector provides the 4 signal wires from the anemometer. I wired them like this:
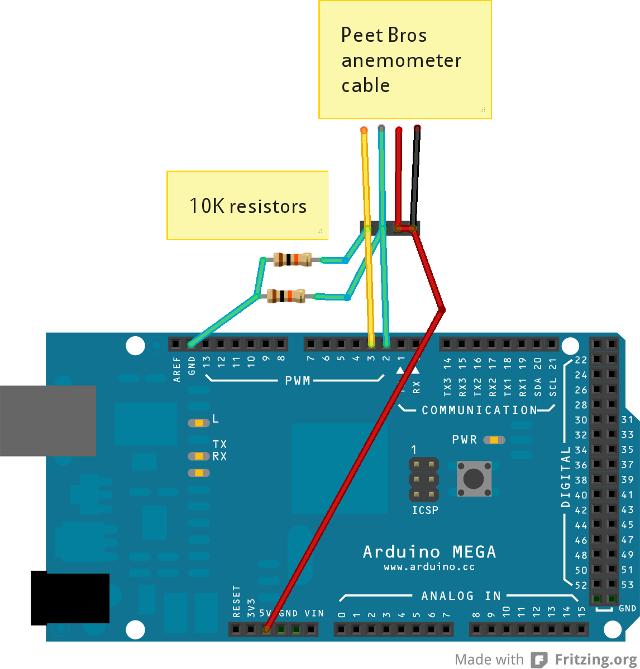
NOTE I just found that picture as an example, I actually wired mine to 3.3V and to different pins because I’m not using an Arduino MEGA. However the way the resistors and Peet Bros cable is connected is the same.
I got a little smarter with this build (which took place a month or so after the first) and included an LCD that I can use for debugging on the device when it’s installed in the field. The picture didn’t show this well at all, but on that screen you can see the current wind speed, direction, battery voltage and failed transmission counter.
My plan is to modify the Base station to also add an LCD in the future.
The LCD itself consumes very little power as long as the backlight LED’s are off… Funny story, when I first built this I left the backlight pin floating (not connected). This seemed fine the backlight was off when I tested things and installed it. Fast forward a few weeks later and the temp is much colder, sunlight is less common and the battery voltage was getting depleted on the anemometer much quicker than I was expecting:
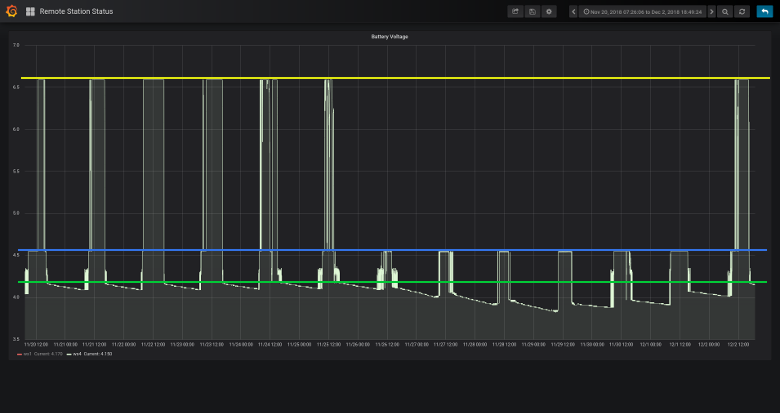
The above graph shows the battery voltage over time, well, what it actually shows is the output of the solar charger circuit which varies based on a few things.
The yellow line is about 6.5V when the battery is fully charged and there is good sunlight.
The blue line is about 4.5V which is where we read when the battery is charging and there is good sun.
The green line is 4.2V which is the value of a fully charged battery.
The graph covers a about a 12 to 13 day span.
Thing seemed pretty normal for the first 6 days, the battery would top off in the day and become fully charged and discharge a little at night, then all of a sudden it started discharging more rapidly at night and never getting topped off during the day. When I went to investigate I found the LED backlights for the LCD were on full brightness :(
It turns out there is a small transistor which controls power to the LED’s and the freezing temps had affected it such that it was turning on. To remedy this I stopped floating the pin and grounded it instead, the last few days show the recovery of the battery and return to normal operation.
House Internals
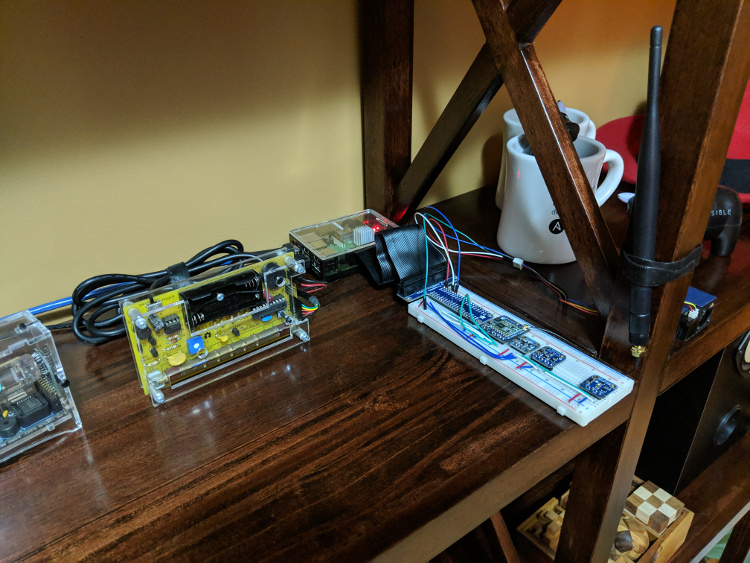
I didn’t built an enclosure yet for the stuff inside the house, I’m not sure if I will or not so instead I neatened up my protoboard as best I could.
Starting on the left is the edge of a clock, to the right of that is my Geiger counter and then back towards the wall is the Raspberry Pi 3 B+, connected to it is a breakout cable and breadboard with the RFM69 module, barometric pressure sensor, temp and humidity sensor, and separated away is a CO2 and VOC sensor. Finally it’s a little hard to see, but to the right of the shelve support is a small air particulate sensor for measuring 2.5um and 10um air particles. I will talk a little more about the geiger counter, and air quality sensors in another blog entry.
All these sensors either speak I2C, SPI or Serial, nothing too fancy here.
Software
Overview
One of my biggest requirements with this project is building it to be as fault tolerant as possible, that is, if a sensor or piece of something breaks, I want to contain what breaks to as small an interruption to the whole system as possible.
I spent a huge amount of time investigating how I could accomplish redundancy in key systems to prevent a single point of failure. Sadly this really proved much too difficult for the time and money I was willing to put into this project (since I had already spent too much of both :) )
To combat the lack of redundancy in key systems I put effort into documenting how things are configured and automating as much of that configuration as I could with Ansible.
The most important system in the chain right now is the Raspberry Pi pictured above, it’s the receiver for all radio traffic and also runs the MQTT broker.
Speaking of the MQTT broker, this was my message broker/format of choice because of its very low overhead and system requirements.
I wanted everything to be as decoupled and small/modular as possible and using MQTT to link everything together is a great way to accomplish that.
Unfortunately even one of the most popular MQTT brokers, Mosquitto, doesn’t really support high availability. So for now I am relying on a high endurance SD card and a well documented/scripted setup procedure for that Raspberry Pi to handle failures.
Rust was my programming language of choice for everything on the Raspberry Pis. I’m new to Rust and learning it was one of my goals for this project. So far I’m really really enjoying it.
Base software
Early on in my career I spent a lot of time programming microcontrollers in C and interfacing them to various motor controllers and sensors very much like this setup. However, my C is pretty rusty these days and in the interest of getting this done as quickly and as reasonably possible, I decided to try out Arduino for programming the Feather boards. Also it helps that Adafruit has drivers and tutorials for each of the sensors I used which drastically simplified things.
The program is fairly simple, it uses the RadioHead library to configure and use the RFM69 radio, and also drivers from Adafruit for the other sensors.
The general structure is to try to keep the device asleep as much as possible, and iterate through a loop, every minute sending the latest readings for temp, humidity and light sensors.
I’m using the ReliableDatagram packet structure to send packets, as such they need an ACK from the other end to be sent successfully. This station will attempt retries 10 times waiting a second or so in between sends.
Rain bucket tips create an interrupt which results in sending a packet just for this information immediately.
Anemometer software
The Pete Bros anemometer has a very clever and very confusing way that it calculates speed and direction, basically it has 2 magnetic reed sensors, a couple magnets and a magnetic shield. As the cups turn the reed switches open and close based on a magnet passing one (speed), and a shield magnet passing the other (direction). If you measure the timing of the pulses from these switches you can determine speed/direction. There is a document from Pete Bros that explains this, I put a copy in the git repo below.
Luckily for me, someone else had already implemented this in an arduino program: https://mechinations.net/wind-v3/ and direct link to source
I used this as a starting point for my source:
I had to undo the changes he had made to output Knots and updated the annoyingly complicated math to output MPH again.
I also included the RadioHead library to interface with the radio and changed a bunch of the timings and other components of his application. But I tip my hat to Tom he saved me a ton of work with his excellent program.
One notable thing different about this vs the base station, the wind speed packets are sent as normal Datagrams and do not wait for an ACK. Given the frequency they are sent it would be a lot of unnecessary chatter over the air, and losing a packet or two isn’t really a big deal.
Normally wind speed measurements are sent once a second and battery level measurements once a minute (these are sent as ReliableDatagrams which lets me put the retransmissions counter on the LCD as well as send it over the air to give me insight into the health of the RF link). If the wind speed isn’t changing I slow the rate down to once every five seconds.
Indoor software
This is broken down into several Rust programs to keep things as modular and focused as possible. As mentioned above, I’m using Mosquitto for MQTT. I looked at all the pure Rust MQTT implementations and all of them gave me a little pause, so in the end I chose a wrapper someone had created around the Mosquitto native C client. Getting this to cross compile was kind of tricky and most of the README’s in this project explain the steps necessary.
sensor_lib
At the heart of it all is the data model contained in this library.
rfm69_to_mq
This program interfaces to the RFM69 receiver module and its sole purpose is to receive messages, send ACKs if necessary and put those messages into an MQTT topic.
A couple notes… I have gone through a few iterations of how I wanted to send data via MQTT messages, and I’ve also gone through a few iterations of how I should store my data. As a result there is already a little kruft in this application, and a few places where I think it could be cleaned up… Mainly I started by using a very narrow table model and Prometheus as a datastore, but I migrated to Timescale and moved some of my readings into wide tables. This required creating MQTT messages which had correlated values in them and the way I generated those is a little crude at the moment and could use some work…
mq_to_postgresql
This guy lives on the other side of the MQTT broker and subscribes to topics. When a message comes in, it’s read and written into Timescale.
indoor_sensors
This also runs on the main Raspberry Pi and captures data from all the sensors on that board pictured above.
This is some of the more recent Rust programming I’ve done to this point and has some neat features like multi-threaded execution with locks to prevent conflicts on the I2C bus.
As mentioned before, there are a lot more sensors being read by this library but I’ll touch on those in another post.
se_basement
This runs on a Raspberry Pi Zero W in my basement and is wired to a pulse counter on my propane meter to track propane consumption, it also reports the basement temperature and humidity.
oled_monitor
Sitting next to me on my desk is another raspberry pi which I connected a little oled display:
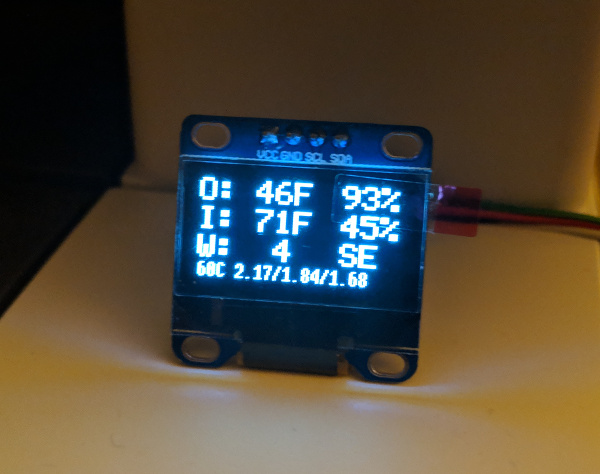
It gives me the outside temp and humidity, inside temp and humidity, current wind speed and direction.
Across the bottom are some system stats from that Raspberry Pi, CPU temp and system load averages.
This app listens directly on the MQTT topics for messages and displays the new values as they come in.
Conclusions
Effort
I have been making an effort to closely track my time to improve my ability to estimate work efforts in an app I made called timegraveler
I pulled the output for this project:
| TASK_ID | TASK_NAME | TOTAL_HOURS | ESTIMATE |
|---|---|---|---|
| 1379 | #weather setup air particle sensor | 16.6 | 0 |
| 1272 | #weather write messges to TimescaleDB | 15.3 | 0 |
| 1240 | #weather build enclosure for base station feather | 15.3 | 3 |
| 1209 | #weather simple test receive program in Rust on ras pi | 12.9 | 4 |
| 1213 | #weather get ack's working on transfer | 12.7 | 4 |
| 1263 | #weather write messages to prometheus | 8.4 | 0 |
| 1241 | #weather install outside | 8.1 | 5 |
| 1351 | #weather setup basement monitoring (temp/humidity and gas meter) | 8 | 0 |
| 1212 | #weather figure out packet format/addressing for mqtt | 6.8 | 4 |
| 1231 | #weather RFM69 receive interrupt | 6.8 | 3 |
| 1363 | #weather build enclosure for anemometer | 6.2 | 4 |
| 1362 | #weather build anemometer arduino app | 5.8 | 3 |
| 1247 | #weather setup light sensors | 5.8 | 0 |
| 1198 | #weather document | 5.7 | 0 |
| 1368 | #weather install electric monitor | 4.6 | 0 |
| 1211 | #weather get encryption working on radio link | 4.4 | 2 |
| 1214 | #weather rust project connect to MQ | 4.2 | 4 |
| 1245 | #weather order parts | 3.6 | 0 |
| 1237 | #weather add air quality to ras pi | 3.4 | 3 |
| 1380 | #weather radon monitor | 3.2 | 0 |
| 1361 | #weather dig holes and set poles for anemometer | 3.1 | 3 |
| 1239 | #weather setup rain gauge | 3.1 | 3 |
| 1354 | #weather start apps with services | 3.1 | 0 |
| 1364 | #weather install anemometer | 3 | 3 |
| 1236 | #weather add humidity to ras pi | 2.8 | 0 |
| 1238 | #weather add radiation to ras pi | 2.5 | 3 |
| 1365 | #weather troubleshoot high packet loss | 2 | 0 |
| 1262 | #weather figure out how I want to write/store data | 1.9 | 2 |
| 1355 | #weather make library for mq client | 1.5 | 4 |
| 1235 | #weather add bmp280 to ras pi | 1.4 | 6 |
| 1260 | #weather load messages into mqtt | 1.3 | 2 |
| 1208 | #weather simple test send RF program into feather | 1.3 | 2 |
| 1207 | #weather setup ras pi (OS, Network, Auto Updates, Email) | 1.2 | 2 |
| 1381 | #weather fix sgp30 baseline | 1.2 | 0 |
| 1233 | #weather setup humidity sensor on feather | 1 | 1 |
| 1374 | #weather update oled_monitor with windspeed | 1 | 0 |
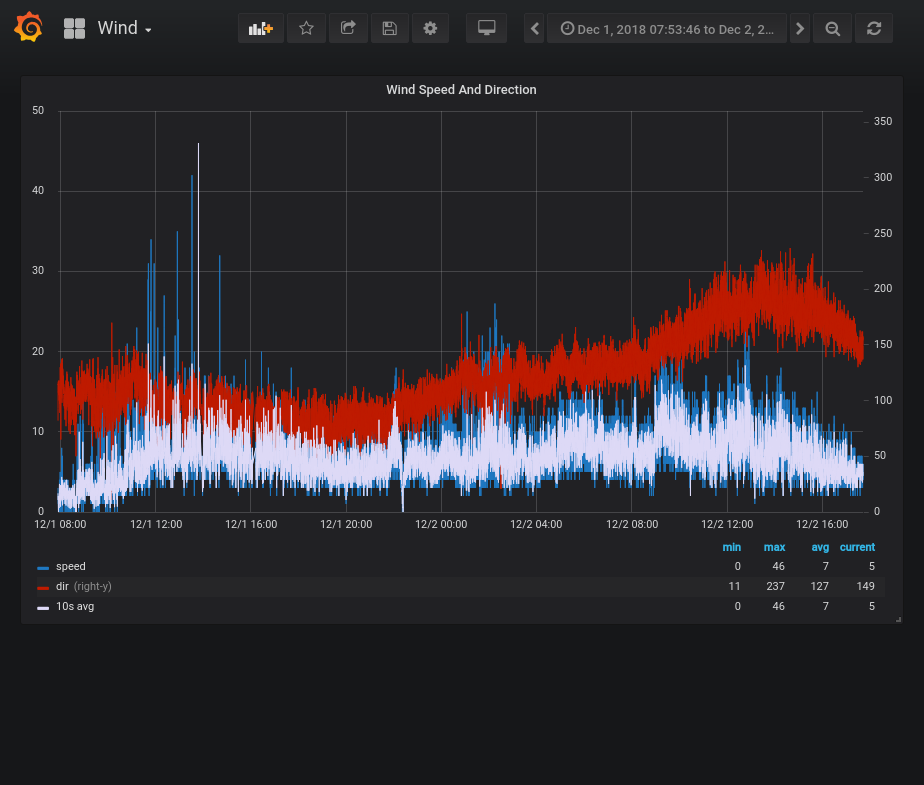
| 1375 | #weather capture wind data | 1 | 0 |
| 1353 | #weather setup hardware better in office | 1 | 0 |
| 1271 | #weather fix leading zero on float to string | 0.8 | 0 |
| 1234 | #weather feather programming | 0.6 | 6 |
| 1333 | #weather replace temp/humidity sensor on feather | 0.4 | 0 |
| 1274 | #weather increase retry timeout on feather | 0.2 | 0 |
| 1215 | #weather setup MQ broker | 0.2 | 1 |
| TOTAL | 192 |
I need to make an effort to be more diligent about putting in estimates. It also never ceases to amaze me how long the physical stuff takes like building enclosures and installing/wiring. It also reminds me why I prefer to write software now :)
Cost
As I mentioned when I started, I loosely added up the cost of all my Adafruit orders with the cost of the rain bucket and anemometer, the grand total in parts was right around $1000 USD. Some day I’d like to itemize all this out exactly but I doubt that number would go down if I did.
My Thoughts?
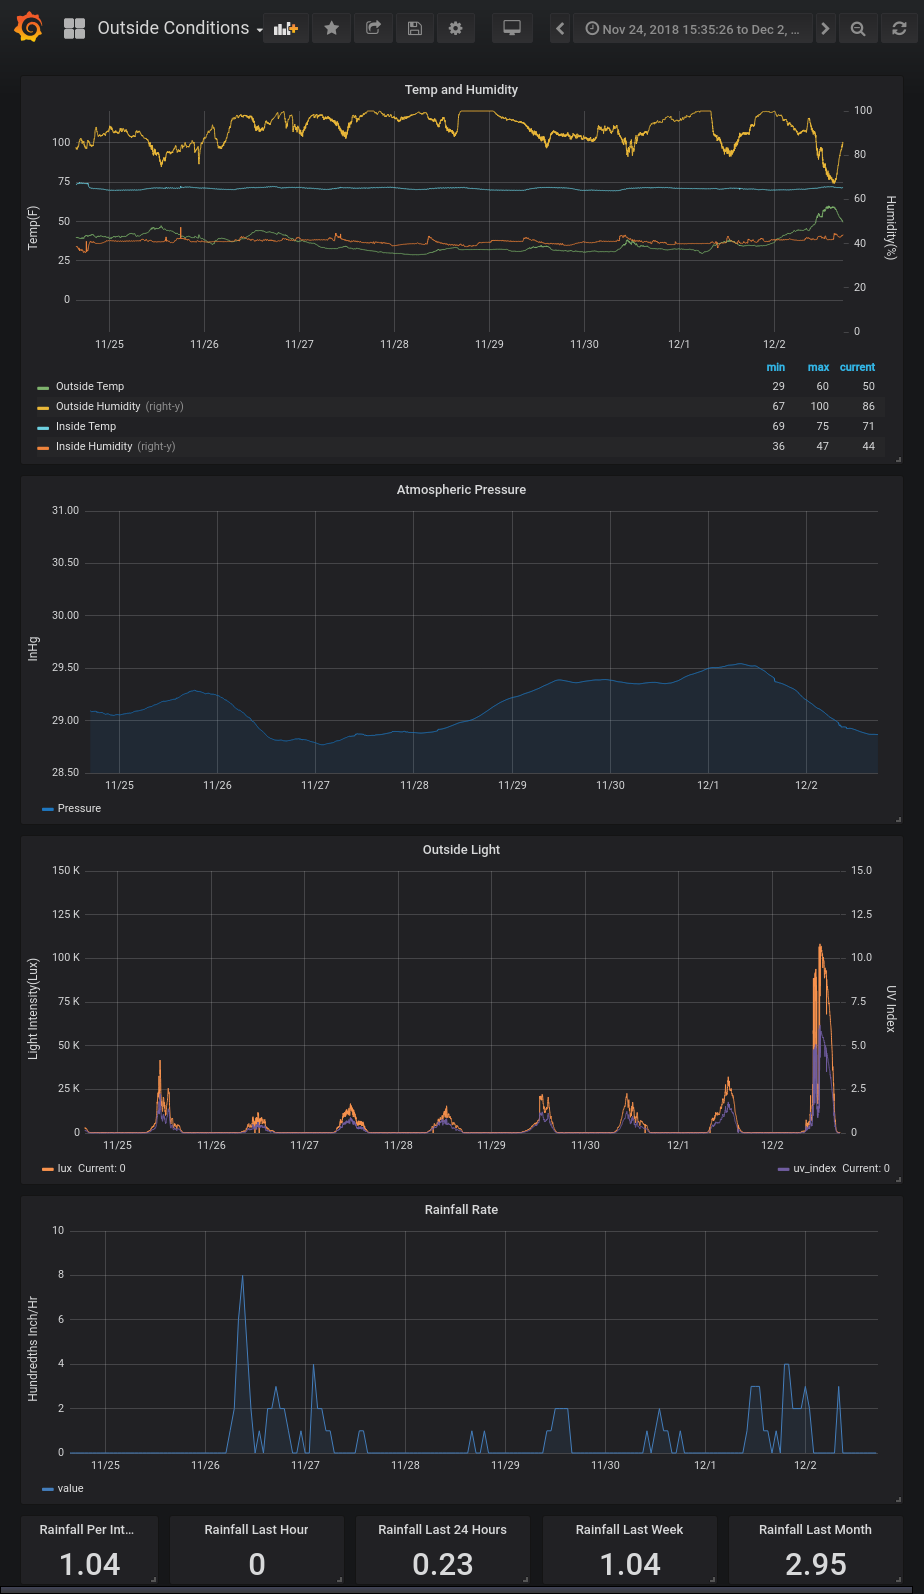
It’s hard for me to explain how satisfying it is looking at these graphs in Grafana. I love sensor data and seeing it captured in and around my house makes me incredibly happy.
This project also gave me a great reason to continue learning a new programming language: Rust, and that has a huge amount of value to me. After many years of writing Java I was itching to get back to a native language, I did a brief stint with C++ a year ago on another sensor project but I walked away from that mostly annoyed with C++. I don’t feel that way at all with Rust and look forward to using it wherever I can in the future.
As far as the cost? Good off the shelf weather stations easily run in the $700 to $1000 range and they generally have terrible API’s for storing the data in your own database, so I may have spent a little more but I think I’m much happier with the end result.